Let your data shine with Graphmatik
An approachable no-code platform for scientific analysis and data visualization.

Science is hard enough. Data visualization doesn't have to be.
Even the best data presented poorly will lack impact. That's why Graphmatik combines best-practices in scientific reporting with intuitive designer graphics. Striking a perfect balance between informative yet elegant visualizations... all in a matter of seconds!
Performance
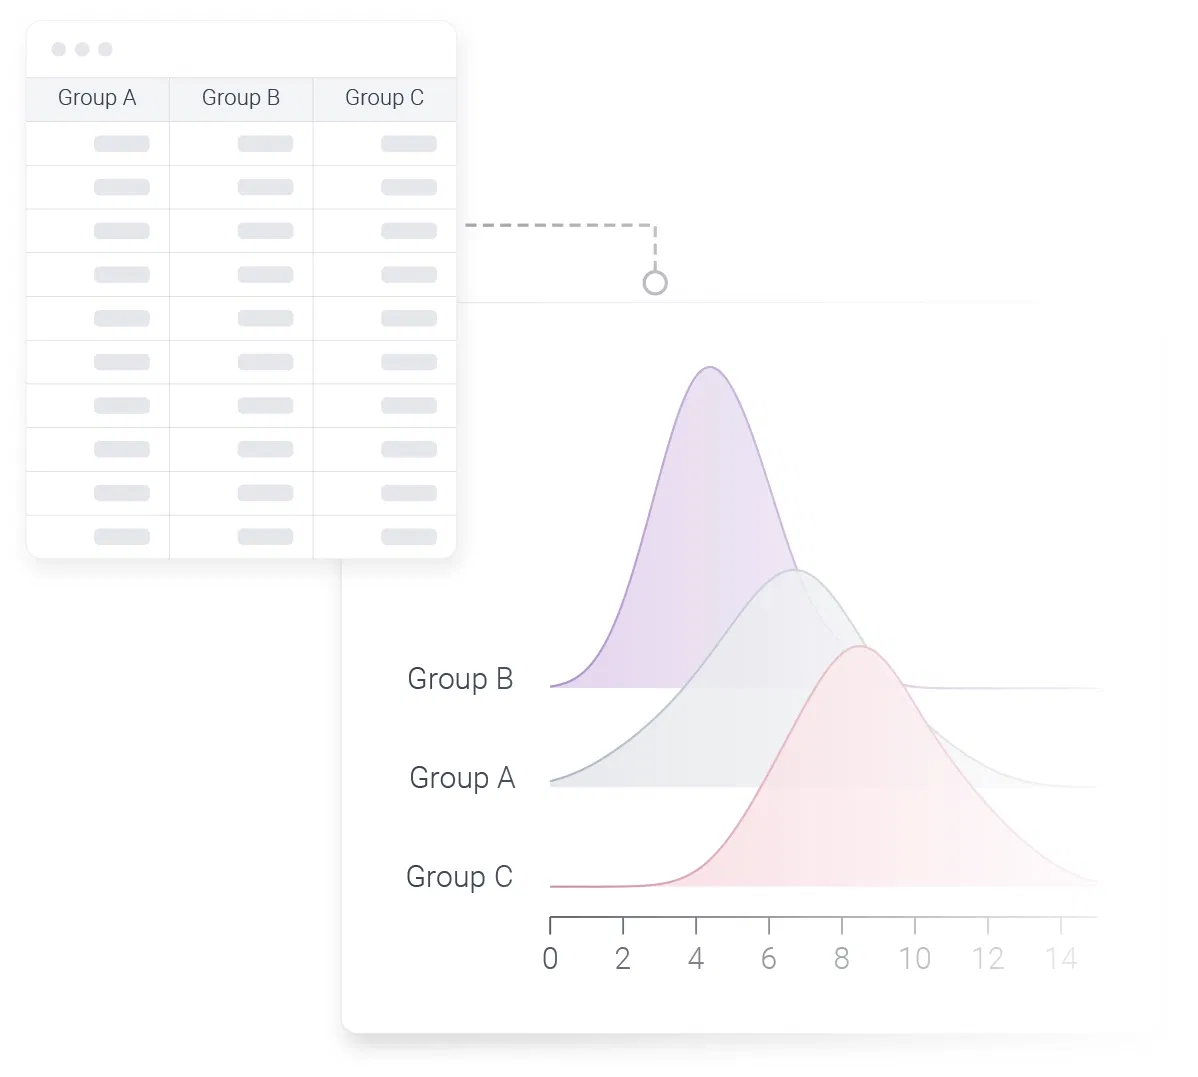
It’s fast — real-time reactivity
Graphmatik updates in real-time ensuring a silky-smooth user experience from data input, to visualization and analysis.
Watch Tutorial Advanced features
Machine learning-powered analysis
Under the hood Graphmatik uses machine learning to fit your data, helping you derive insights faster.
Free Sign Up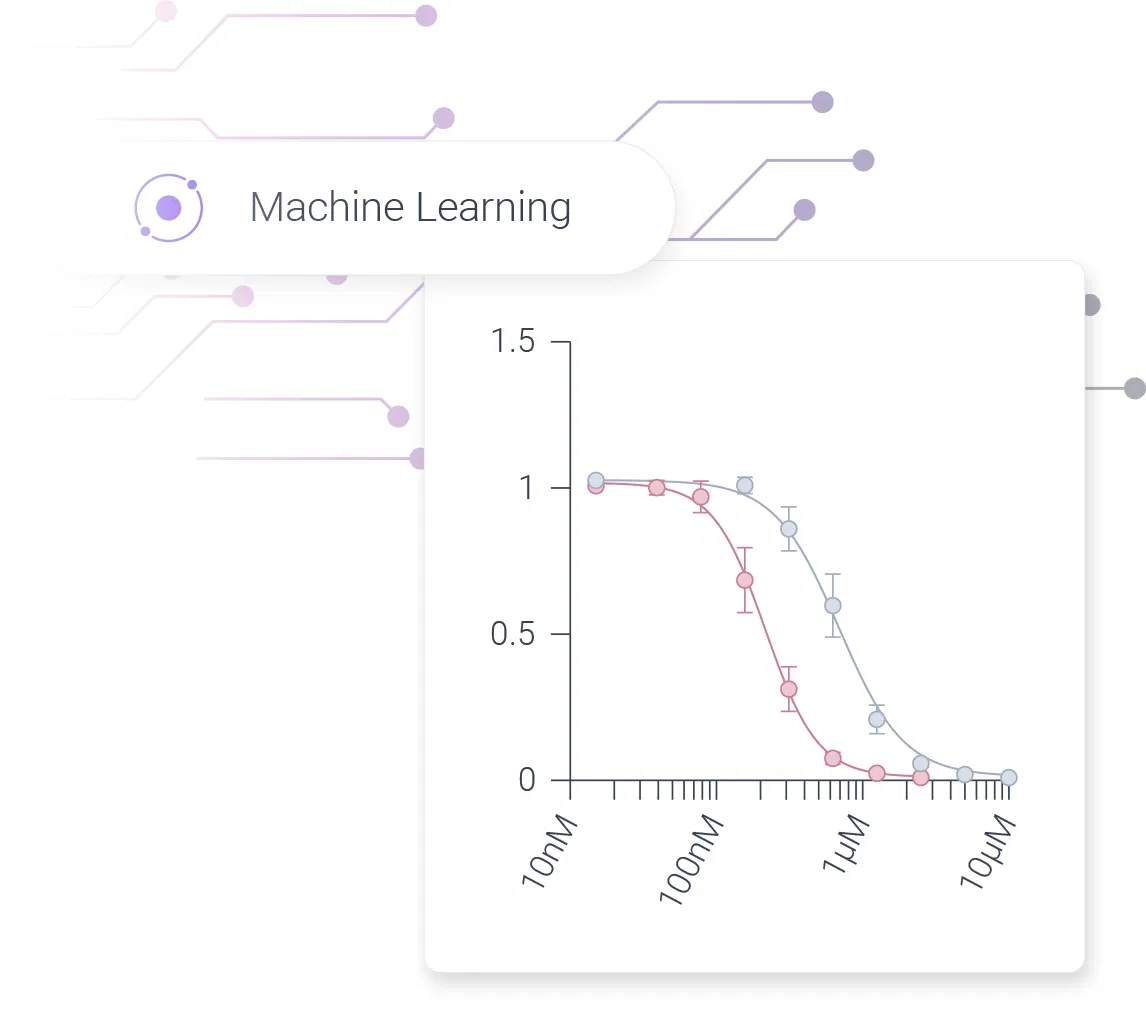
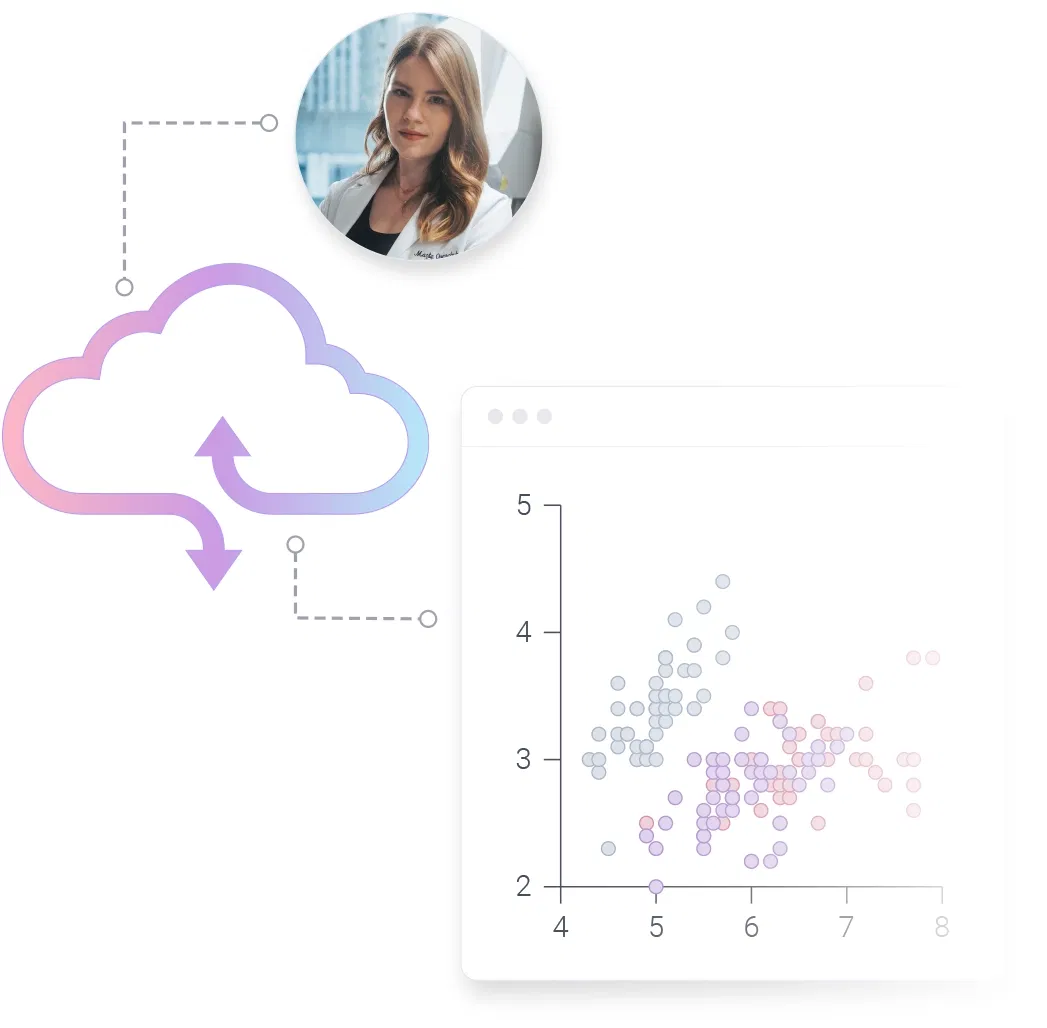
Cloud-driven
Take your analysis anywhere!
Graphmatik uses the latest in web technology to provide a desktop-like user experience right in your browser.
Free Sign UpFrequently Asked Questions
You bet it is! Graphmatik software is free of charge for personal, academic, and even most commercial use cases. Ready to get started? Sign up for free today! For all the specifics on usage, you can check out our End User License Agreement and Terms of Service.
We get it. "Sounds too good to be true", right? But we promise, there's genuinely no catch. Our mission is simple: we want to empower hardworking scientists like yourself with modern, elegant, and effective tools to share your research as seamlessly as possible, all without breaking the bank.
We take your data privacy seriously. We do NOT store or collect any data you enter into Graphmatik for data processing, analysis or visualization. In fact, Graphmatik is designed to run entirely locally within your browser. We only collect the personal information you provide during sign-up, and you can learn more about how we protect that data in our Privacy Policy.